When updating a few Azure WebJobs to a new version of the WebJobs SDK, I had to rewrite the way they logged data. This led to a few lessons learned, which I’m happy to share for anyone who is working with the same tools.
Note:
A lot in this blog is applicable to Azure Functions as well!
Table of contents
- Logging for the ancients
- Logging in Microsoft.Azure.WebJobs 3.x
- Querying the logs
- Extending logged information using Scopes
- Cost considerations
- Sampling
- Monitoring for WebJob exceptions
- Concluding
Logging for the ancients
Those of you who created WebJobs before, using the Microsoft.Azure.WebJobs v2 package, probably know it. They used to have a fine (but limited) logging dashboard. The logs where stored in an Azure Storage Account that you had to reference using an appsetting/connectionstring called AzureWebJobsDashboard. The dashboard was surfaced through the Kudu tool and showed a list of runs (invocations). For timer jobs as well as queue based jobs you could see the state, whether the run succeeded and the trace logs of the invocations.
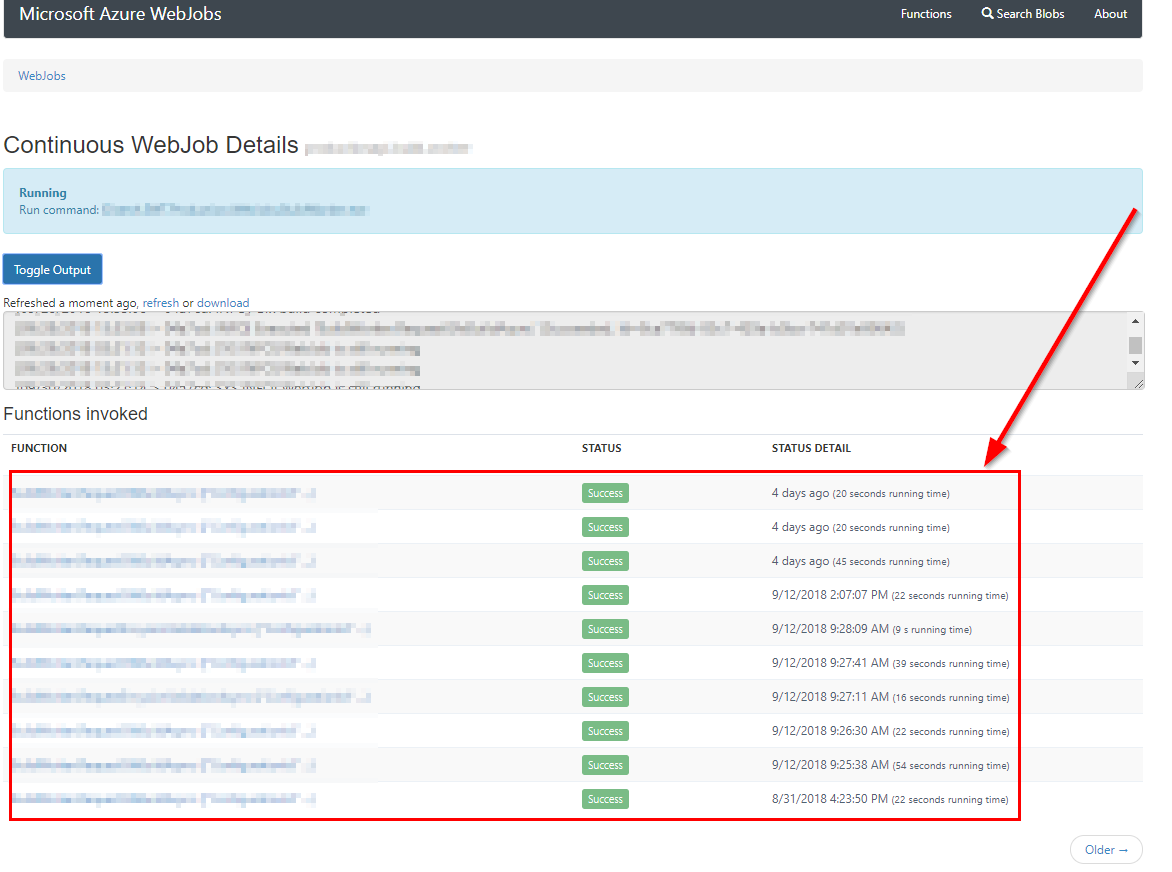
This was severely limited. You could not search or filter the logs in any meaningful way. But I liked in nonetheless. WebJob runs could be viewed in realtime and all trace logging showed up nice and easy. With a WebJob running in the background, trace logging is my number one resource to find out if all is going well. So it’s important!
Logging in Microsoft.Azure.WebJobs 3.x
With the advent of v3 of the WebJobs SDK a few years ago, this all changed. The SDK was changed drastically, became much more flexible and modularized, and the way to log changed as well. You still need a Storage Account and an appsetting/connectionstring called AzureWebJobsDashboard, but the Dashboard will now only show the early startup logs of the WebJob. The logs will be truncated after the number of lines passes a certain point. Invocationlogs can no longer be viewed from the dashboard. It’s clear Microsoft is moving away from the Kudu Dashboard where logging is concerned. You’re advised to use Application Insights instead.
Configuring logs can be done using the hostBuilder, and could look as follows:
hostBuilder.ConfigureLogging((context, b) =>
{
    b.SetMinimumLevel(LogLevel.Information);
    b.AddConsole();
    b.AddApplicationInsightsWebJobs(o => { o.ConnectionString = ConfigurationManager.ConnectionStrings["AzureWebJobsDashboard"].ConnectionString; });
    //Available after installing the Nuget package Microsoft.Azure.WebJobs.Logging.ApplicationInsights
});
Using the injected ILogger you can now log to Application Insights as follows:
public void SomeTimerJob([TimerTrigger("0 0 3 * * *")] TimerInfo timerInfo, ILogger logger)
{
    // This will only be included if minimum level is set to LogLevel.Debug
    logger.LogDebug("SomeTimerJob verbose/debug logging");

    // Do some things

    logger.LogInformation("SomeTimerJob was run");
}
Querying the logs
Using the Logs tab in Application Insights we can now extensively query and filter on trace logs, using Kusto (KQL) queries:
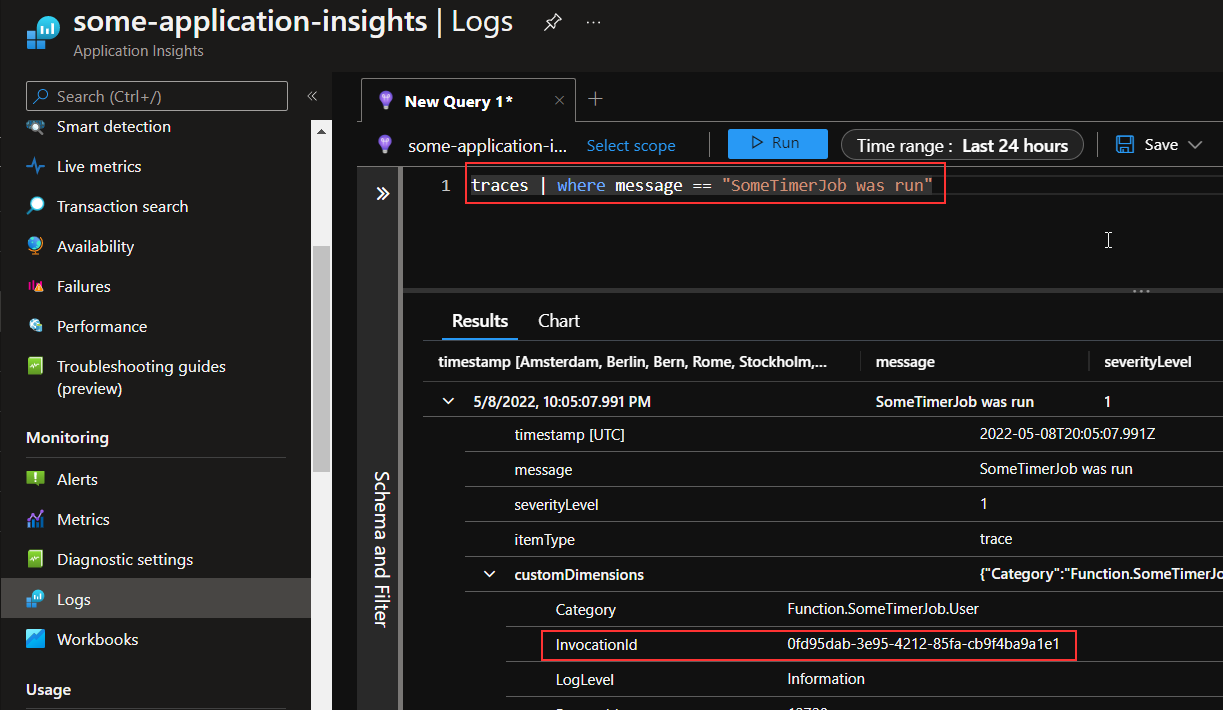
Every returned row contains a customDimensions object with an InvocationId, which we can use to query all the trace logs of a specific run. This can be done for example by running the following query:
traces
| where customDimensions.InvocationId == "0fd95dab-3e95-4212-85fa-cb9f4ba9a1e1"
| sort by timestamp asc
Extending logged information using Scopes
Granted, querying logs like this is more work than it was when viewing the invocation logs in the old v2 kudu dashboard. And you need to wait a few minutes before the logs show up. (Unless if you’re using the Live Metrics pane) But it’s very flexible. And that becomes clearer if we extend the logging a bit by using Scopes. The following code adds a few extra customDimension properties to every line that’s logged within the using statement:
public void SomeTimerJob([TimerTrigger("0 0 3 * * *")] TimerInfo timerInfo, ExecutionContext executionContext, ILogger logger)
{
    var extraProperties = new Dictionary<string, object> {
        { "WebJob", "TimerJobs" },
        { "WebJobTrigger", executionContext.FunctionName },
        { "SomeUserGuidOrRecordId", "..." }
    };

    using (logger.BeginScope(extraProperties))
    {
        logger.LogDebug("SomeTimerJob verbose/debug logging");

        // Do some things

        logger.LogInformation("SomeTimerJob was run");
    }
}
We can now query runs in the following manner, which will show a list of all runs (one row per invocation):
traces
| where customDimensions.prop__WebJobTrigger == "SomeTimerJob" and message == "SomeTimerJob was run"
| sort by timestamp desc
Or we can query a cross-section of all logging about a certain user or record by running the following:
traces
| where customDimensions.prop__WebJobTrigger == "SomeTimerJob" and customDimensions.prop__SomeUserGuidOrRecordId == "..."
| sort by timestamp desc
You can save your queries in Application Insights, so you are able to run them again without rewriting. You can do a lot with this, and I find it very powerful!
Cost considerations
There’s a few things to keep in mind when logging to Application Insights. One is the possible price tag. I once moved three WebJobs (with a few timer and queue functions each) to the v3 SDK and to Application Insights. After a few days I decided (on a whim) to look at the costs, and I was glad I did. The amount of data that I logged to Application Insights was astounding: 8 Gb per day! Using a Log Analytics Workspace and the Pay-as-you-go pricing tier, you’ll pay €2.843 per Gb for Data ingestion. So this would cost me roughly 22 euro per day!
You can solve this in a few ways.
- You can configure your log tables as Basic Log tables, instead of Analytics Log tables. The costs for Basic Logging are much lower per Gb of Data ingestion. More info can be found here.
- … or you can try to log less data to Application Insights.
Logging less
I took the last route. I first tried to reduce the amount of trace logging by switching some logging calls to logger.LogDebug('...'). I reviewed what I wanted to know about my WebJobs, and what was information I could hide unless when in Debug mode. I used an appsetting to control the minimumlevel (b.SetMinimumLevel(LogLevel.Information);), to be able to change to verbose logging in a running application without republishing.
Unfortunately, this didn’t prove effective enough at reducing the amount of data ingestion. I then did some digging and it turns out you can (of course you can 🤦♂️) view more detailed insights about what gets logged. You can open the Insights blade on the Log Analytics Workspace for this. In my case it showed me the following:
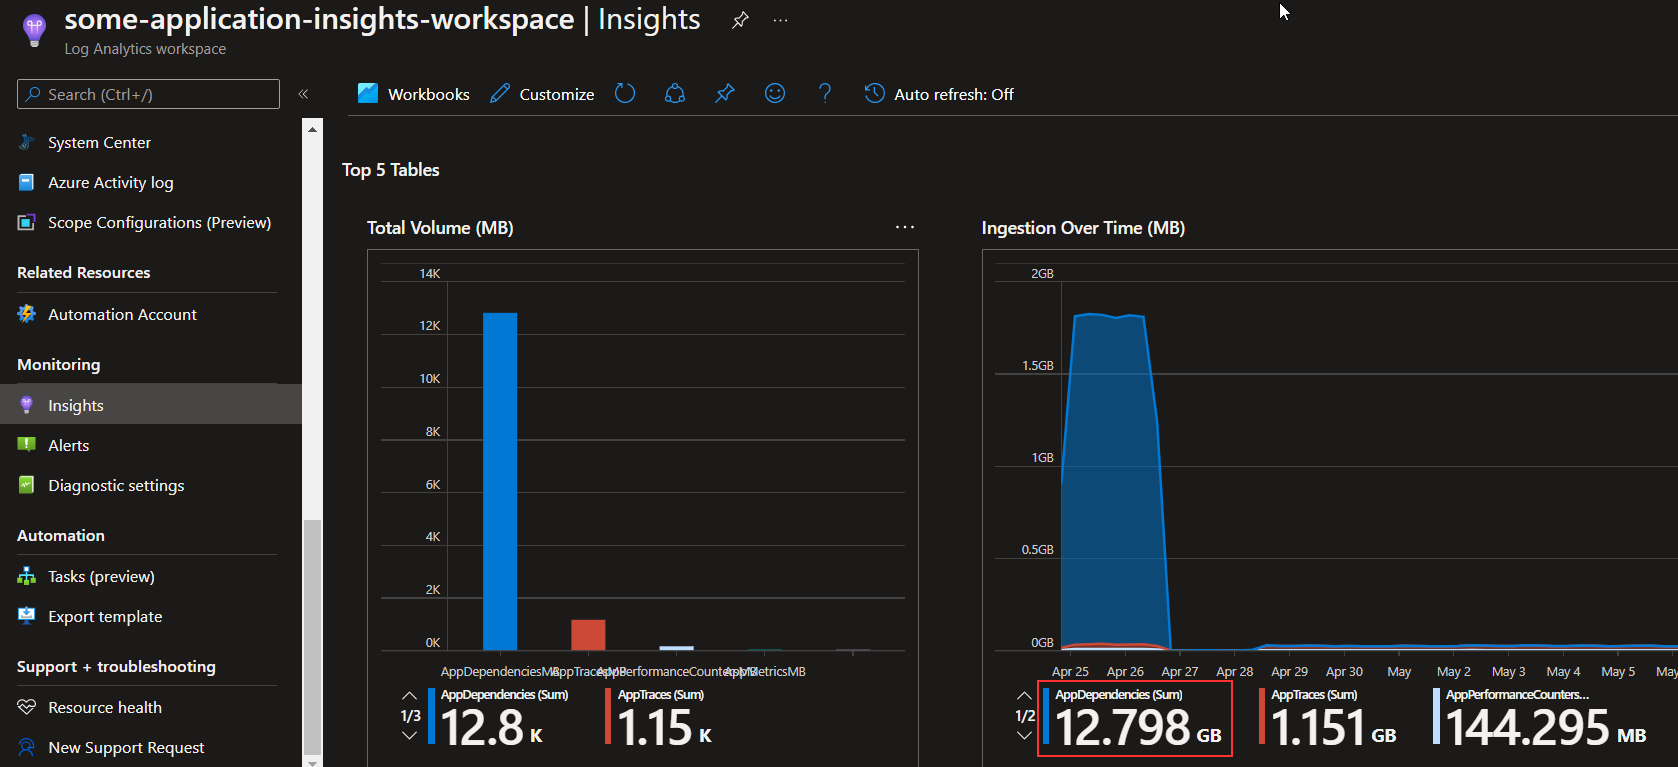
Apparently, the largest amount of data was Telemetry about dependencies. And sure enough, if I would query traces in Application Insights, there was a lot (!!) of rows about Database connections and certain HTTP requests. Application Insights tracks these dependencies and that’s helpful in certain scenario’s. But in my case it was not worth the costs. So I excluded Dependency Tracking by changing my WebJob Logging configuration as follows:
b.AddApplicationInsightsWebJobs(o =>
{
    o.ConnectionString = ConfigurationManager.ConnectionStrings["AzureWebJobsDashboard"].ConnectionString;
    o.EnableDependencyTracking = false;
});
And as you can see in the image timeline, this more or less flatlined the spike of Data Ingress.
Sampling
A second topic to keep in mind is sampling. By default, the Application Insights SDK will limit the volume of telemetry that is send over the wire to the Application Insights servers. The purpose of this is to help you manage costs by reducing data ingress. Application Insights itself determines what exactly is cut away, so the important pieces remain. There are three ways sampling can be configured:
- Adaptive sampling (Clientside sampling)
- Fixed-rate sampling (Clientside sampling)
- Ingestion sampling (Configurable from the Azure Portal)
There is never more than one version of sampling active. Of the three, Adaptive sampling is enabled by default, it’s where Application Insights determines what gets cut, based on the number of telemetry calls per second (among other things).
I personally dislike sampling for WebJobs, as trace logging is all I have when monitoring WebJob runs. I like it to be complete. Even if no exceptions are occurring.
Adaptive sampling can be disabled, but I personally like it better to control what gets excluded from sampling. I configured the logger to exclude the Trace and Exception types from sampling as follows:
b.AddApplicationInsightsWebJobs(o =>
{
    //omitted for brevity...
    o.SamplingExcludedTypes = "Trace;Exception";
});
Now of course, it’s important to keep checking how much data is actually logged. If the costs exceed what you wish to spend, you can always configure a daily cap from the azure portal. Your data will be trimmed when it reaches that cap, but at least the data you do have is complete.
Monitoring for WebJob exceptions
Another area of thought is how to deal with exceptions. In many cases it would be apt to have some kind of notification that things are amiss. In Application Insights you can configure alert rules that send Email/SMS (and other types of) notifications for this kind of thing. However, a large application with an API and several WebJobs may throw a lot of exceptions that you don’t really need to hear about right away. You don’t want an alert rule that captures any and all exceptions.
For WebJobs I therefore like to use try catch statements wrapping my function code to log my own custom exceptions wrapping the actual exceptions:
try {

    // Do some things

    logger.LogInformation("SomeTimerJob was run");

} catch (Exception ex) {
    var exceptionWrapper = new SomeTimerJobException(ex);
    logger.LogError(ex);
    throw exceptionWrapper;
}
I can now build a log query in Application Insights as follows:
exceptions | where outerType == "MyApplication.CustomExceptions.SomeTimerJobException"
The Logs blade offers a ‘New Alert rule’ button where I can immediately configure this log query to run (for example) once every hour, and send a notification whenever this exception type results in rows returned. This incurs a small cost, depending on how often it runs. But it’s certainly worth the additional cost. By giving these alert rules a recognizable name, I’ll know right away from my inbox what WebJob threw an error without navigating to Application Insights. I find this a very powerful feature indeed, allowing me to act on important issues shortly after they occur.
Concluding
Azure WebJob logging has changed. Application Insights is a logical choice to use for this. Featurewise it gives you great power. But with great power also comes some responsibility. We need to think well about what things we actually want to get logged. And we need to keep in mind what costs our tools are incurring. That picture needs to be clear as day. If you do have that clear, it’s happy sailing to you my friend!
Sources
- Azure WebJobs how to
- Application Insights Cost management - Basic vs analytics logs
- Application Insights Sampling
- Application Insights Alert rules
appinsights logging webjobs appservice azure
More
More blogs
Logging and tracing with Azure Durable Functions
Durable functions are awesome... this post shows how to see what happened end-to-end in a durable function instance.
Read more
Working with Microsoft Teams PowerShell in Azure Automation
How to work with Microsoft Teams PowerShell and Managed Identity in Azure Automation
Read more
Common errors deploying Azure Bicep and ARM templates
Recently, I deployed some Azure resources using ARM and Bicep templates for a few customers. This is a write up of some errors I ran into.
Read moreThanks
Thanks for reading

Thanks for reading my blog, I hope you got what you came for. Blogs of others have been super important during my work. This site is me returning the favor. If you read anything you do not understand because I failed to clarify it enough, please drop me a post using my socials.
Warm regards,
Martin
Microsoft MVP | Microsoft 365 Architect