
Durable Functions are a great feature of Azure Functions if you’re into extending Microsoft 365. They can be used to execute long running business processes, with or without user interaction. An ideal companion to SharePoint Framework (SPFx) in customization scenario’s. But how can you view all the logs from a single run end-to-end? Everything that happened in every Durable Function Activity? This blog post helps you set that up.
What are Durable Functions
Durable Functions are a way to build a stateful application… on serverless computing. That sounds like an oxymoron, but it isn’t. Anyway: I like them because of their versatility. They allow me to build applications that can run for lengthy periods of time and take multiple steps in a preconfigured order. They’re ideal companions of the consumption plan, making it easier to have long-running processes, without having to be afraid of the maximum 10 minute runtime of Azure Functions in that plan. They can be used to create things like approval processes and serial or parallel jobs that all belong together in a single process.
So what’s the deal with logging?
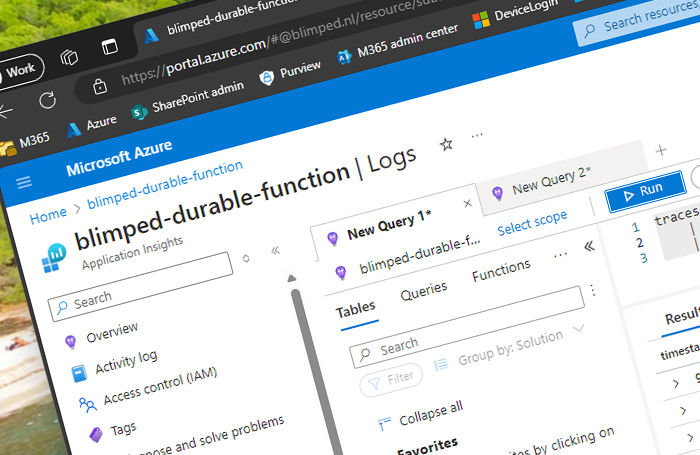
Using Azure Monitor / Application Insights, it’s fairly easy to view the logs from a single Azure Function run. I generally do that in Kusto using a query on the traces table:
traces
    | where customDimensions.InvocationId == "fc528fcd-2118-4c33-b970-4aeeb45d99ce"
    | sort by timestamp asc
However, with Durable Functions, the Orchestration and all the Activities are actually separate functions that are invoked… well separately. Hence, the InvocationId is not the same across all these activities, meaning it’s hard to see all logs together. There’s also no orchestration Id that can be used to query on. I find that odd, but fortunately we can add it ourselves. The following is how I’ve set things up, and what the result is.
Setting up the Durable Function
I’m using the following basic setup in my Program.cs file. This is mostly boilerplate, but with a few additions to get Application Insights working in an Isolated Process. This is actually mostly copied from the Microsoft Docs Guide, but it’s an important part these days with the isolated model being the only model left:
// I load an appsettings.json file to manage logging settings on the worker process as opposed to logging settings on the host process.
var configuration = new ConfigurationBuilder()
    .SetBasePath(Directory.GetCurrentDirectory())
    .AddJsonFile("local.settings.json", optional: true, reloadOnChange: true)
    .AddJsonFile("appsettings.json", optional: true, reloadOnChange: true)
    .AddEnvironmentVariables()
    .Build();

var host = new HostBuilder()
    .ConfigureFunctionsWebApplication()
    .ConfigureAppConfiguration(configBuilder => configBuilder.AddConfiguration(configuration))
    .ConfigureServices(services => {
        services.AddApplicationInsightsTelemetryWorkerService();
        services.ConfigureFunctionsApplicationInsights();

        services.AddTransient<ISomeService, SomeService>();

        services.Configure<LoggerFilterOptions>(options =>
        {
            // The Application Insights SDK adds a default logging filter that instructs ILogger to capture only Warning and more severe logs. Application Insights requires an explicit override.
            // Log levels can also be configured using appsettings.json. For more information, see https://learn.microsoft.com/en-us/azure/azure-monitor/app/worker-service#ilogger-logs
            LoggerFilterRule? toRemove = options.Rules.FirstOrDefault(rule => rule.ProviderName
                == "Microsoft.Extensions.Logging.ApplicationInsights.ApplicationInsightsLoggerProvider");

            if (toRemove is not null)
            {
                options.Rules.Remove(toRemove);
            }
        });
    })
    .Build();

host.Run();
The appsettings.json file that I use is as follows, just a basic setup that disables sampling for trace logging. I understand the idea behind sampling, which is Application Insights only ingesting samples of your logging data, instead of everything. It’s great to reduce logging ingestion and therefore costs. But in this case I’d like to be able to view the steps my application takes, and sampling gets in the way of that. The following does that:
{
    "logging": {
      "logLevel": {
        "default": "Information"
      },
      "applicationInsights": {
        "logLevel": {
          "default": "Information"
        },
        "samplingSettings": {
          "isEnabled": true,
          "excludedTypes": "Trace;Exception"
        },
        "enableDependencyTracking": false
      }
    }
  }
In my .csproj file I need to make sure the appsettings.json file is included when building and when publishing the application, otherwise it will not be available while debugging or after deployment:
<!-- Adding this just below the lines about local.settings.json -->
<None Update="appsettings.json">
    <CopyToOutputDirectory>PreserveNewest</CopyToOutputDirectory>
    <CopyToPublishDirectory>PreserveNewest</CopyToPublishDirectory>
</None>
Update 15-01-2025 - Using distributed tracing
A colleague of mine recently ran into the possibility to configure distributed tracing on Durable Functions. Distributed tracing allows us to correlate logging across the entire Durable instance using a single operation ID. It’s awesome and very easily configurable and hence probably a better option than the rest of this blog post.
However: if you ever want to add additional properties to your logs to be able to search logs by (for example) customer number or project number, you can still follow the below guide, as logger.BeginScope is awesome for such situations.
Configuring distributed tracing on Durable Functions is quite easy. You just have to add the following lines to your host.json file:
{
  "version": "2.0",
  /* ... */
  "extensions": {
    "durableTask": {
      "tracing": {
        "DistributedTracingEnabled": true,
        "Version": "V2"
      }
      /* additional configurations */
    }
  }
}
The following basic kusto query will give you a nice list of all traces and exceptions logged in a single Durable Instance:
traces
| union exceptions
| where operation_Id == "086a67bf0c054aefa7da302570495550"
| project timestamp, itemType, message
Using logger Scopes
Logging in the Orchestration
Having done the setup to get our logging to Application Insights, we can now focus on writing the correct logging statements. The idea is that we want to add an extra property to every log line that is sent to Application Insights. We can do that by using _logger.BeginScope. In the following example, I’ll show how to get the Id of the Orchestration Instance, and use that in the Orchestration itself to get all loglines decorated with the Id correctly.
👉 The largest part of the following code is boilerplate code you get when creating a new Azure Functions project. ❗
[Function(nameof(DurableFunctionsOrchestration))]
    public static async Task<List<string>> RunOrchestrator(
        [OrchestrationTrigger] TaskOrchestrationContext context)
{
    // In a durable orchestration function, we need the replay safe logger:
    ILogger logger = context.CreateReplaySafeLogger(nameof(DurableFunctionsOrchestration));

    // We use the BeginScope method on the logger to decorate all logs with the OrchestrationInstanceId
    using(logger.BeginScope(new Dictionary<string, object>{ ["OrchestrationInstanceId"] = context.InstanceId }))
    {
        logger.LogInformation("Hello World Orchestration started.");

        // We call our activities here
        outputs.Add(await context.CallActivityAsync<string>(nameof(SayHelloActivity), "Tokyo"));
        outputs.Add(await context.CallActivityAsync<string>(nameof(SayHelloActivity), "Seattle"));
        outputs.Add(await context.CallActivityAsync<string>(nameof(SayHelloActivity), "London"));
        outputs.Add(await context.CallActivityAsync<string>(nameof(SayHelloActivity), "Rome"));

        logger.LogInformation("Hello World Orchestration complete.");

        return outputs;
    }
}
Logging in the Activities
In the activities we do roughly the same. The one important thing is that we need to add the instanceId parameter to the ActivityFunction. The Orchestration Instance Id will be injected in there by the Azure Function:
public class SayHelloActivity
{
    private readonly ISomeService _someService;

    public SayHelloActivity(ISomeService someService)
    {
        _someService = someService;
    }

    // The important part here is the instanceId string parameter, which gets injected with the orchestration Id automagically!
    [Function(nameof(SayHelloActivity))]
    public string Run([ActivityTrigger] string name, string instanceId, FunctionContext executionContext)
    {
        ILogger logger = executionContext.GetLogger(nameof(SayHelloActivity));

        // We again use the BeginScope function.
        using(logger.BeginScope(new Dictionary<string, object>{ ["OrchestrationInstanceId"] = instanceId }))
        {
            logger.LogInformation("Saying hello to {name}.", name);

            _someService.Communicate(name);

            return $"The activity said hello to {name}!";
        }
    }
}
Logging in DI Services
The last part is services (or really any classes) we inject using Dependency Injection (DI). In these classes we typically request DI to inject an ILogger<ServiceName>. We can just keep doing this, and the result experience is the same. It doesn’t even matter what the instance lifetime is of registered classes. Whether the classes are registered in DI using AddTransient, AddSingleton or AddScoped. As long as calls to methods on those classes are executed from within a logging scope, these will align nicely. Scope properties will get added there as well:
public class SomeService : ISomeService {
    private readonly ILogger<SomeService> _logger;

    public SomeService(ILogger<SomeService> logger)
    {
        _logger = logger;
    }

    public void Communicate(string name)
    {
        if (name == "London")
        {
            _logger.LogWarning("London is not allowed to communicate.");
            return;
        }
        else if (name == "Rome")
        {
            _logger.LogError("Sorry, it was too busy in Rome today!");
            return;
        }
        else {
            _logger.LogInformation($"{name} says hi back!!");
        }
    }
}
The Result
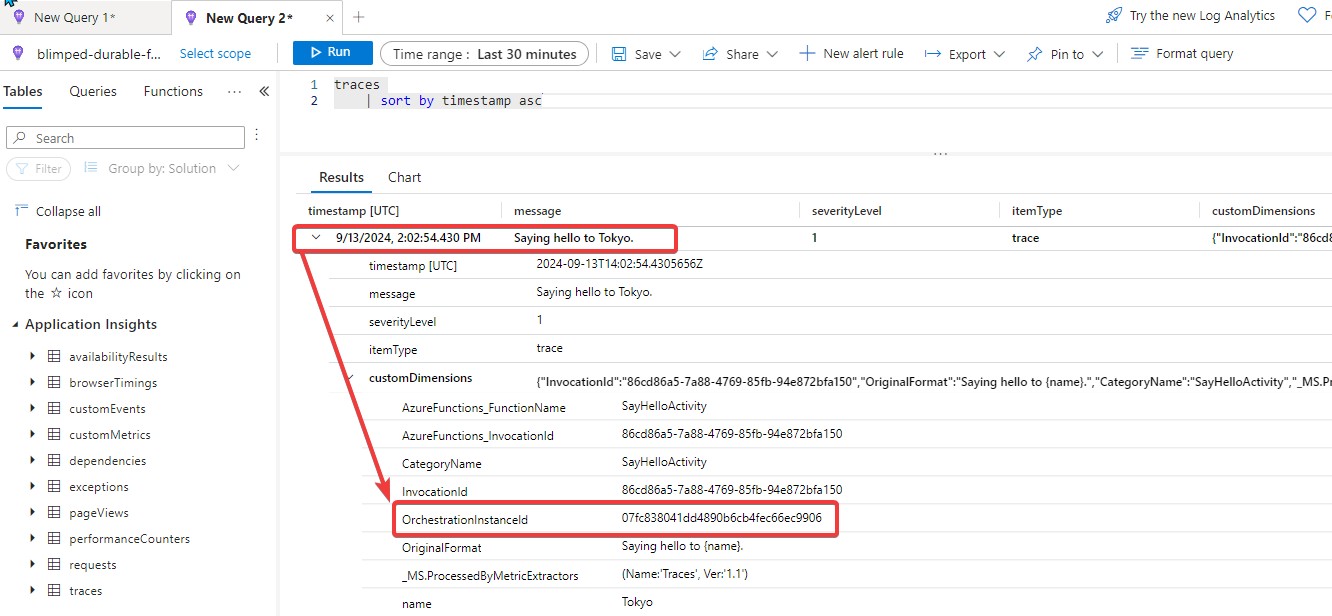
Having set all that up, we can finally run the Durable Function. After calling the Function, it will start logging to Application Insights. We can now retrieve one of most recent traces and see that it has an extra property on the CustomDimensions object:
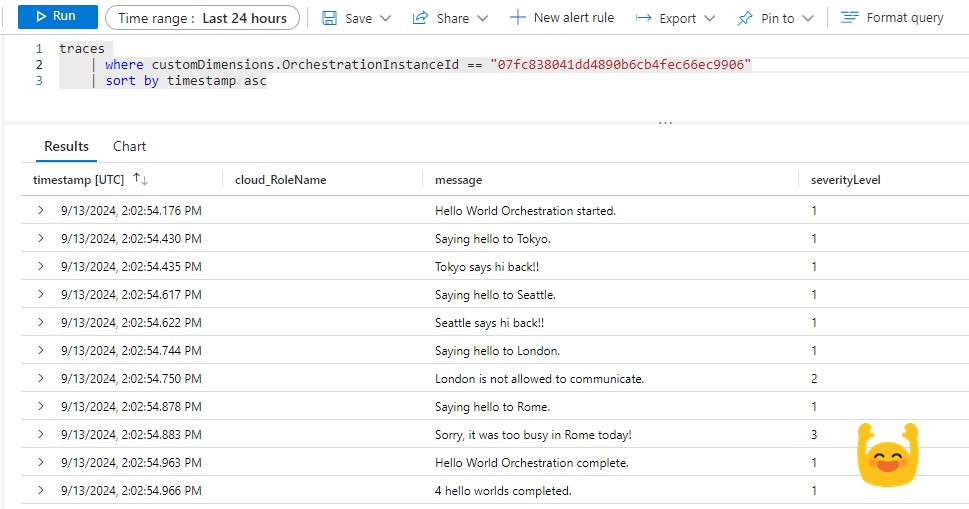
We can now copy the OrchestrationInstanceId and paste it in a kusto query. Running that will give us a super nice overview of what went on in our Durable Function, including warnings and errors! I’m not the king of kusto, and there’s probably a whole lot more fancy stuff you can do here. However it is, this is the basics of it.
Conclusion
Isn’t that awesome? Reading the logs from your orchestration end-to-end! I just love it! It makes it so much easier to know what’s going on…
If you like, you can get the code from my GitHub repository here.
Happy coding!
Sources
- Microsoft Docs - What are Durable Functions
- Microsoft Docs - Durable Functions versions overview
- Microsoft Docs - Overview of Durable Functions in the .NET isolated worker
- Microsoft Docs - Guide for running C# Azure Functions in the isolated worker model
- Blimped - GitHub repository
appinsights logging azurefunction
More
More blogs

Logging to Application Insights from Azure App Service WebJobs
When updating a few Azure WebJobs to a new version of the WebJobs SDK, I had to rewrite the way they logged data. This led to a few lessons learned, which I'm happy to share for anyone who is working with the same tools.
Read more
Calling Entra ID secured Azure Functions from Power Automate
Can you call an Entra ID secured Azure Function from Power Automate? Yes you can, in several ways. This blog post describes one way to do it.
Read more
Finding the minimal Azure Function authentication setup
Using the built-in authentication for Azure Functions is powerful, as long as you optimize it a bit!
Read moreThanks
Thanks for reading

Thanks for reading my blog, I hope you got what you came for. Blogs of others have been super important during my work. This site is me returning the favor. If you read anything you do not understand because I failed to clarify it enough, please drop me a post using my socials.
Warm regards,
Martin
Microsoft MVP | Microsoft 365 Architect